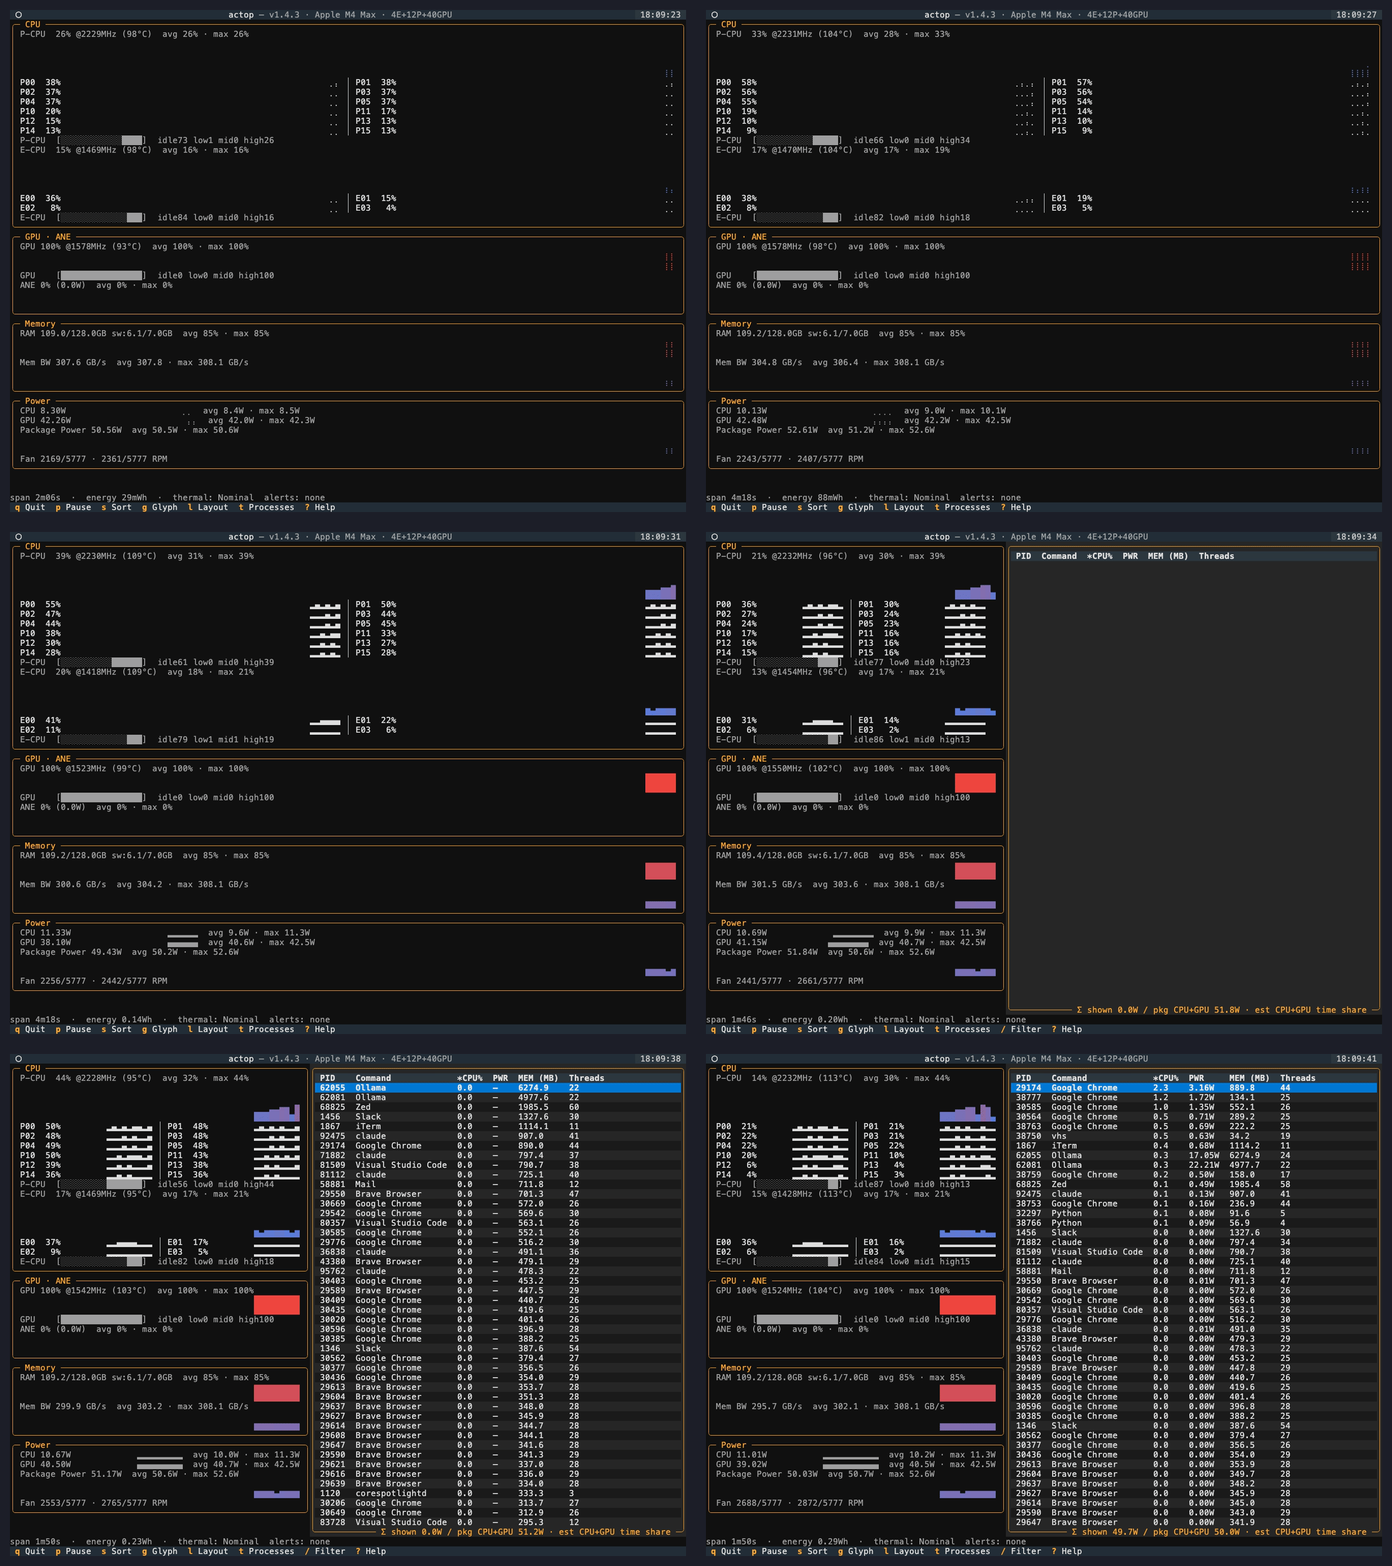
actop reads Apple Silicon power, frequency, and residency metrics directly from
IOReport via Python ctypes — the same library powermetrics uses,
minus the sudo, subprocesses, and temp files.
▮CPU · GPU · ANE
Per-cluster and per-core utilization, DVFS P-state frequency, and power for the P-CPU, E-CPU, GPU, and Neural Engine.
▮Memory bandwidth
Live GB/s against the SoC's peak, with a bandwidth-saturation alert and a MEM-BOUND indicator.
▮Net / disk I/O
Network and disk throughput as mirrored in-over-out charts sharing a zero axis, sourced from native getifaddrs and IOKit counters — no sudo, no subprocesses.
▮Thermals & throttling
CPU/GPU die temperatures from the Apple SMC and the macOS thermal state, with a THROTTLING indicator.
▮Per-process power
A watt-attributed PWR column — per-process power and energy attribution, unique among the sudoless *top tools.
▮Programmable API
Monitor / Profiler with to_pandas() — instrument your own LLM / MLX / CoreML runs from Python.
▮SoC-aware scaling
16 built-in M1–M4 profiles with reference wattage and bandwidth for stable, cross-session chart scaling.
▮Runtime themes
8 built-in Textual themes — nord, dracula, monokai, tokyo-night, and more — cycle live with t or choose at launch with --theme. Independent of the accessibility chart palettes.